The SVG Map widget is one of the best Google map widgets. The SVG map can display Regions, Countries, or any other Geographical data. You can show a tooltip or modal when a region/country is clicked or navigate to a different page or section of the website.
This document will explain the customizations of the widget.
Inserting SVG Map Widget

Use the search bar of the Elementor editor page, search by typing SVG Map, and then the widget will appear on the menu. Just Drag it and Drop it on the page.
Default View of the SVG Map
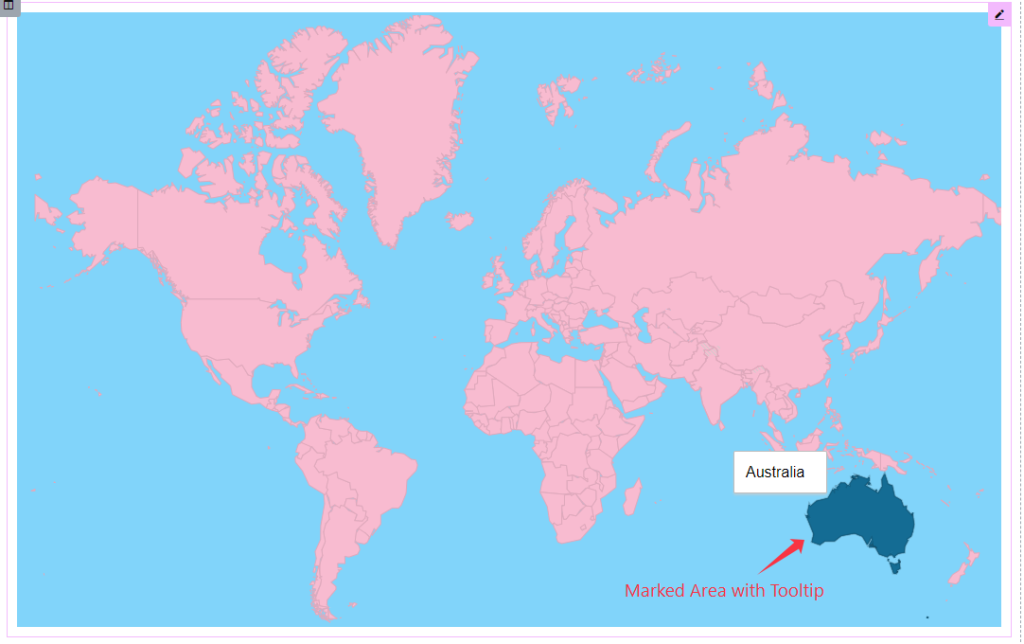
The Word Map with a geographical area Tooltip on the screen is the default view of the widget.
Content Tab Explore
The content tab contains the basic controls of any widget. You can change the default layout using these options one by one. So let’s start with our direction.
Map Settings
Go to Content > Map Settings
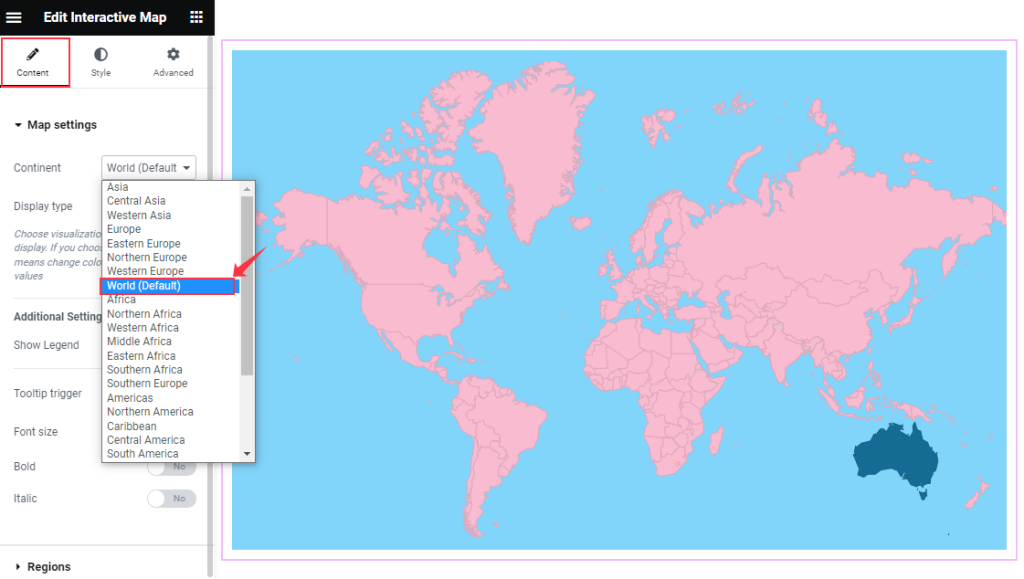
In the Map Settings section, first, you can select the Continent which will be shown on the map. You can choose from the pre-defined continents here (i.e., Asia, Africa, America, Australia, World, etc.).
This demonstration will have the Word(Default) option selected.
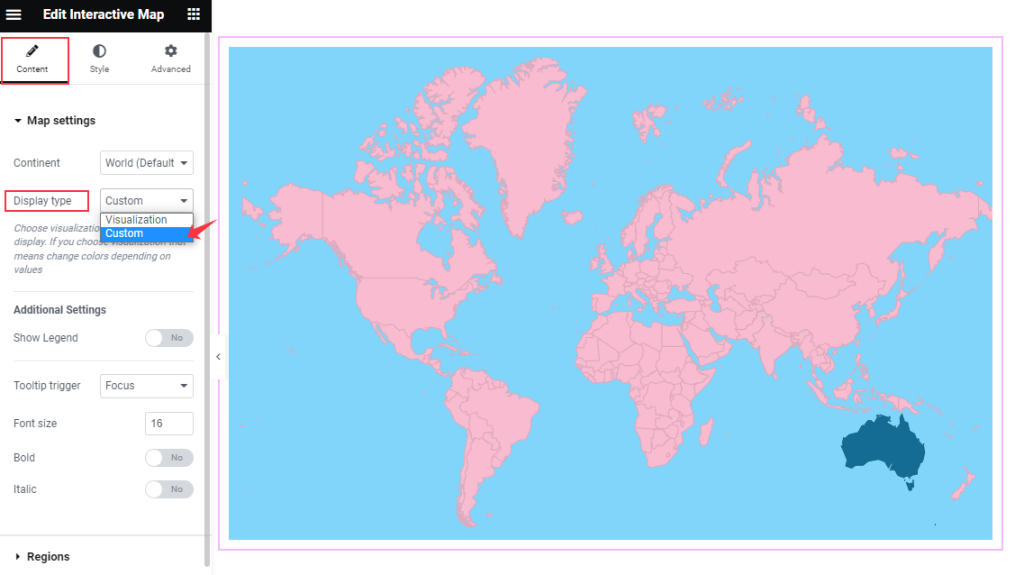
With the Display Type option, you can go with soft Visualization (auto color range and color selectors) and Custom (specific region color setting) map display as you wish.
Additional Settings customization
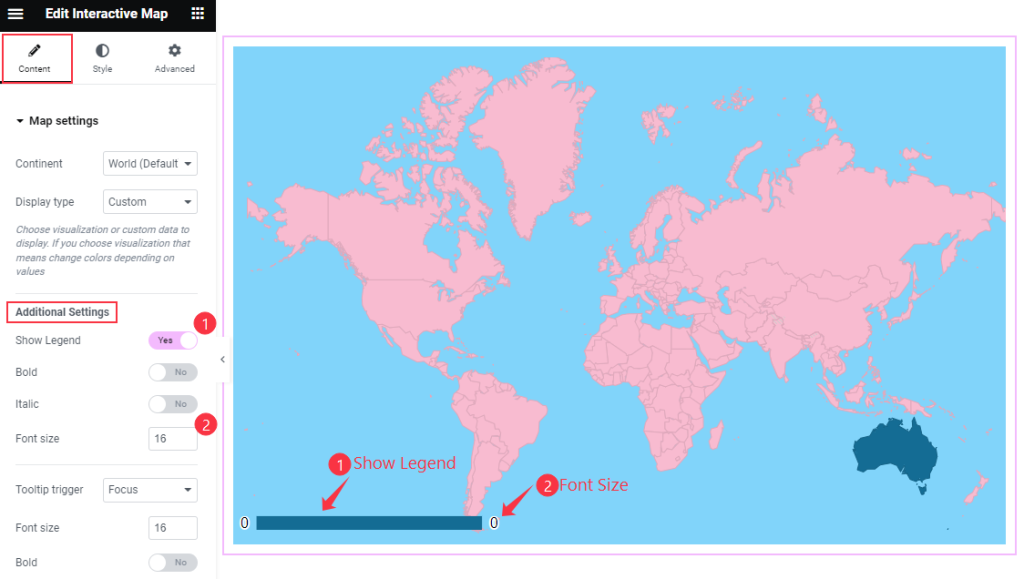
Below, you can see a switcher named Show Legend. When enabled, the map will show a legend bar. You can make the legend counter numbers Bold and Italic if you enable the two switchers. Also, you can set the Font size.
The legend bar can show between minimum and maximum values.
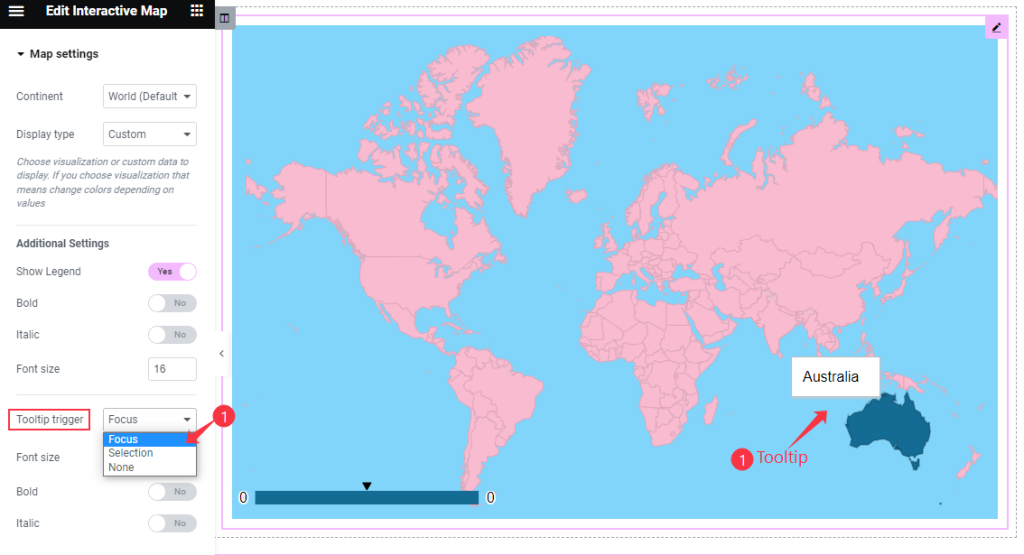
You can select Tooltip Trigger ( Focus, Selection, and None) here. When you select Focus, then hovering over the Geographical area will show the information as a tooltip.
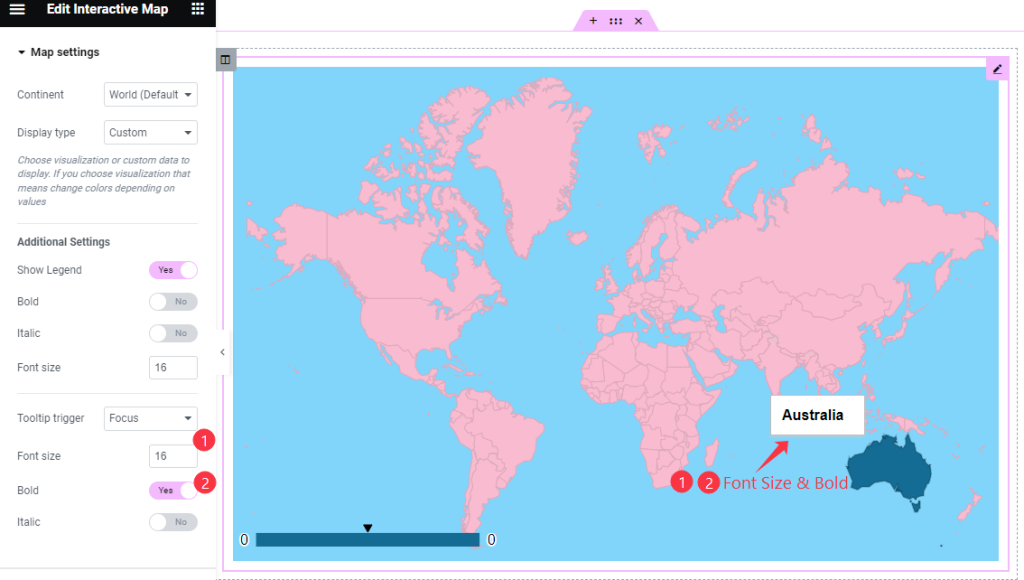
You can also set the Font Size for the tooltip. Also, you can use the Bold & Italic switchers to show the font in bold Style or italic style.
Add Regions
Go to Content > Regions
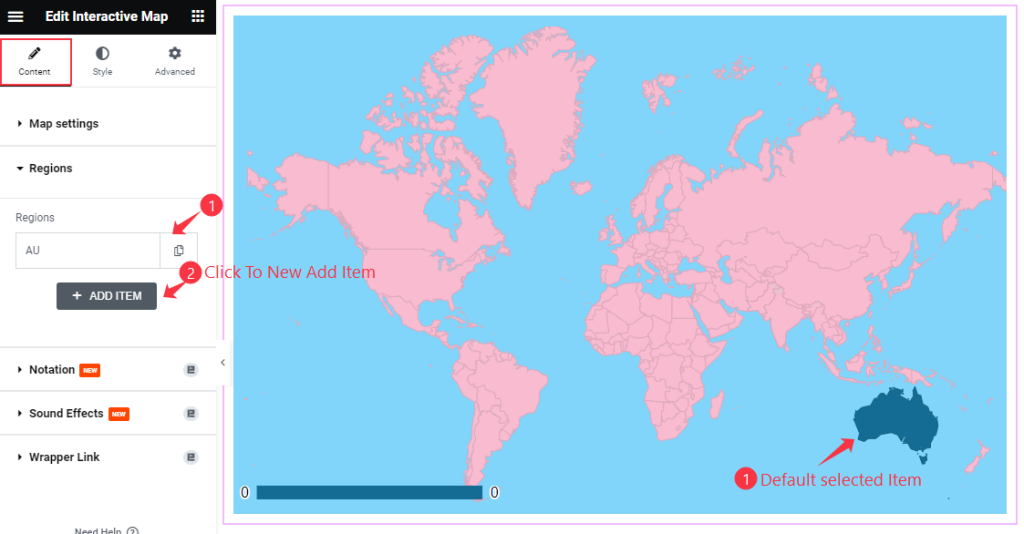
In the Regions section, you can see a default Region is showing. You can add as many items as you want. Just click on the “+ ADD ITEM”
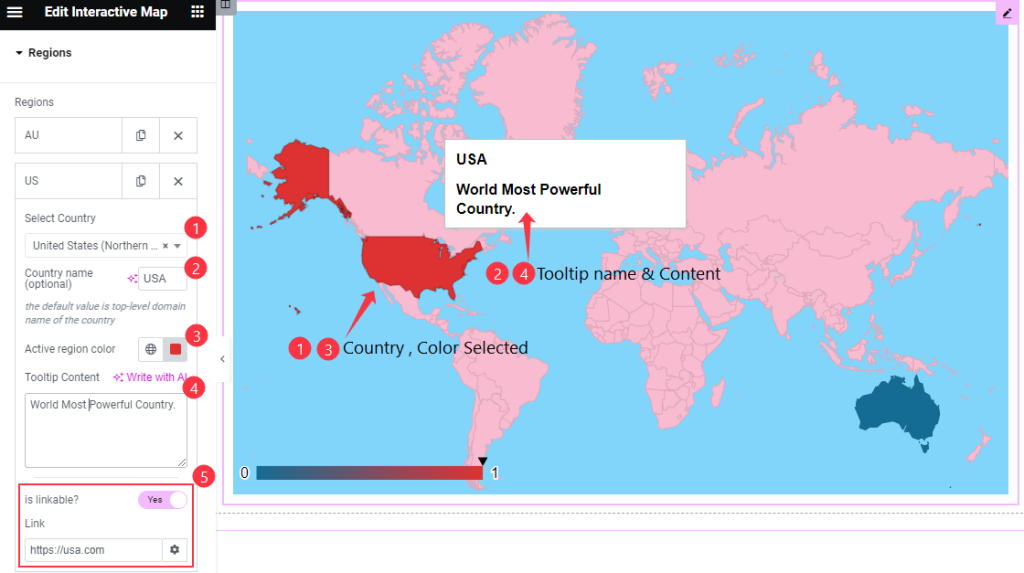
Each item will let you Select Country from the pre-defined options. You may customize the Country Name also. Then assign the Active region Color.
Then you can edit the Tooltip Content field (text and numbers). If you like, you can set the Link for the specific region. When visitors click on the Region, it will open a new tab on the browser to that target link.
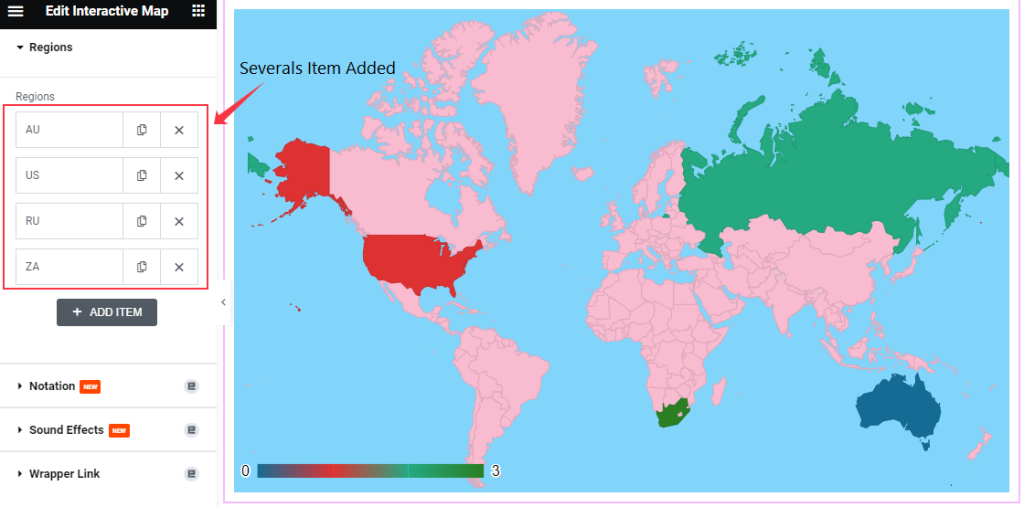
By following these, you can add as many items as you want and show how many countries you want.
Customization with Style Tab
The Style Tab contains the basic options to change the default appearances of any widget. Here we will make an interactive design by using the style tab.
Make the Map Style
Go to Style > Map Style
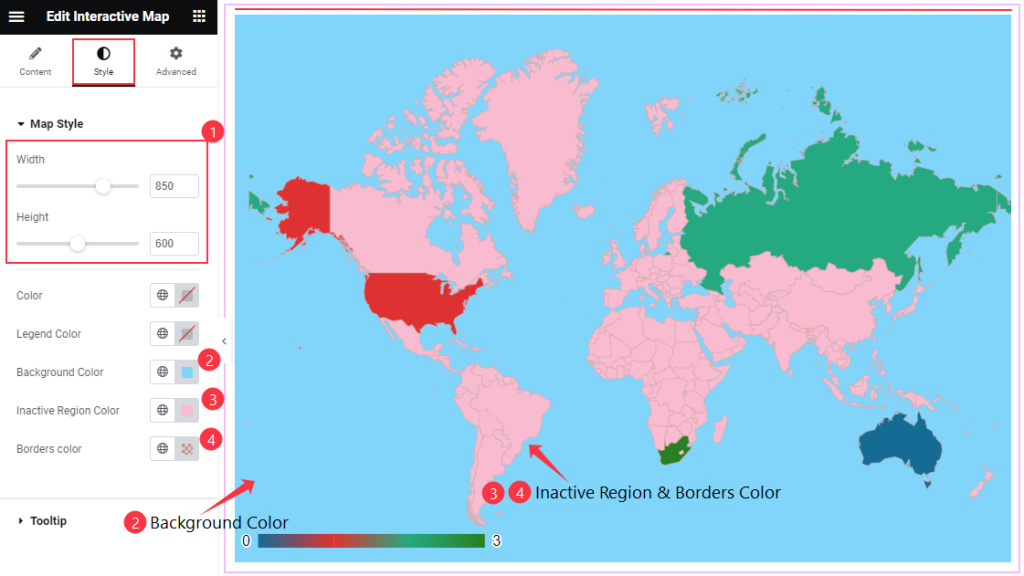
In this Map style section, you can customize the Width and Height of this Map. Then customize the Color, Legend Color, Background Color, Inactive Region Color, and Border Color.
Tooltip Stylization
Go to Style > Tooltip
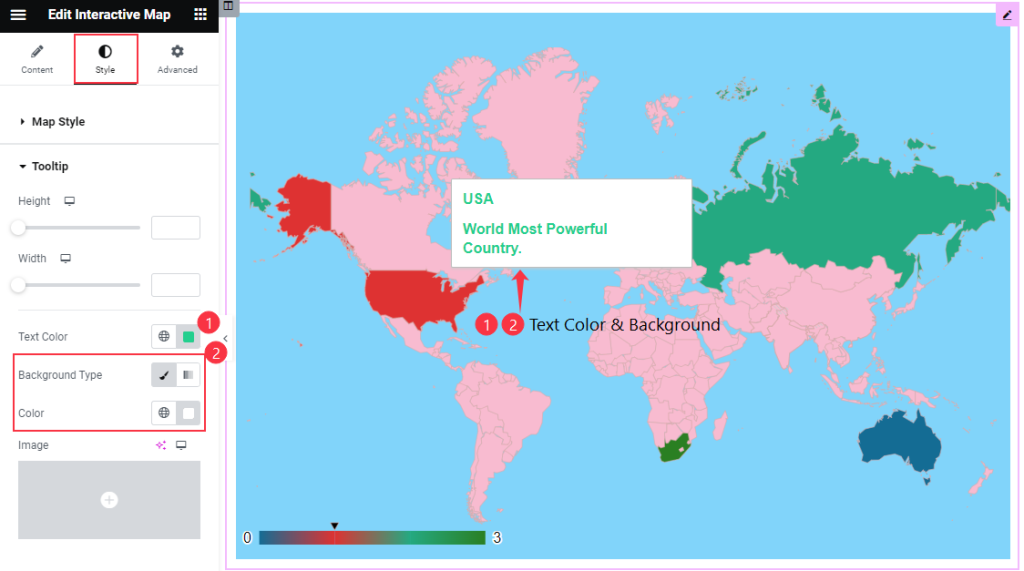
Here, you can set the Tooltip Height and Width. You can customize the Text Color and Background Color also.
Just like that, you can make the SVG Map more interactive and awesome.
Video Assist
The SVG Map widget tutorial video coming soon. Please check the demo page for examples.
Thanks for being with us.