The Chart widget in Elementor is a widely used tool for displaying various statistics on a regular basis. Element Pack made this widget to display stats in eight different chart styles.
Let’s see how to properly use this widget.
Inserting widget

Find the Chart widget from the Elementor page editor’s widget menu and drag it inside your page.
Content tab
The Content tab holds all the base settings for the chart. You can select from different layouts here.
Chart
Go to Content> Chart
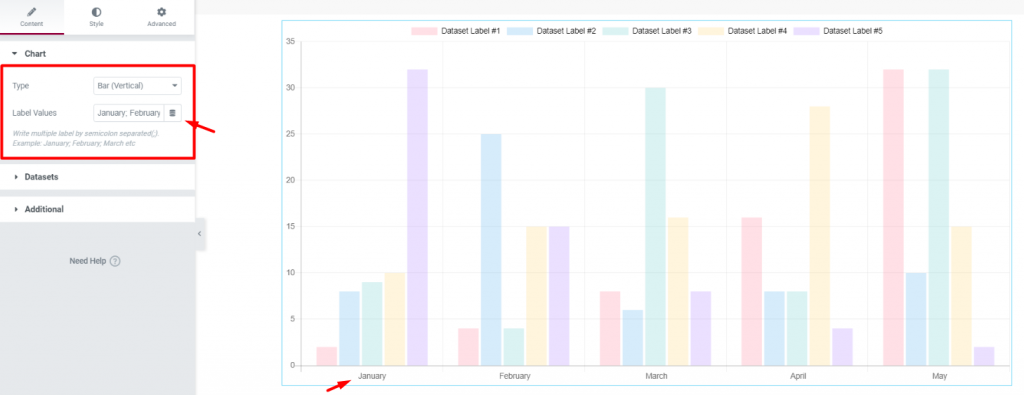
You will find two options here, Type and Label values. The default label is given as the month’s name. However, it can be anything you insert.
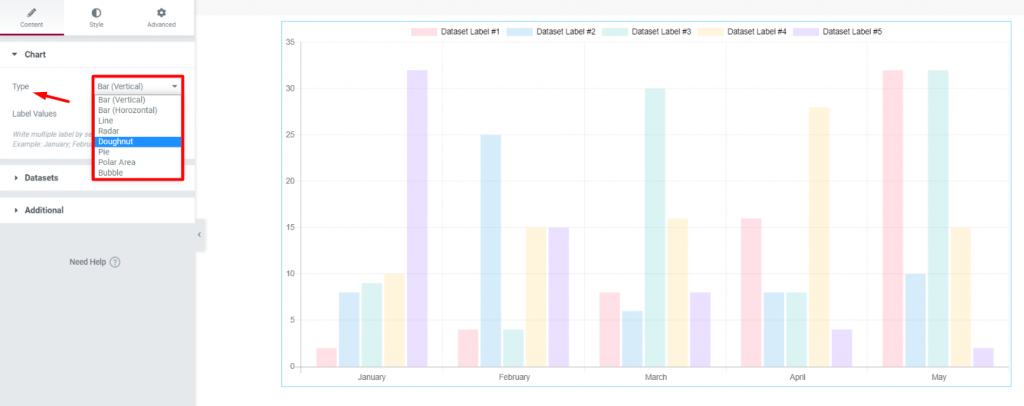
The first option Type has a total number of eight charts. Each one has a unique layout despite having the same variable setup.
Datasets
Go to Content> Datasets
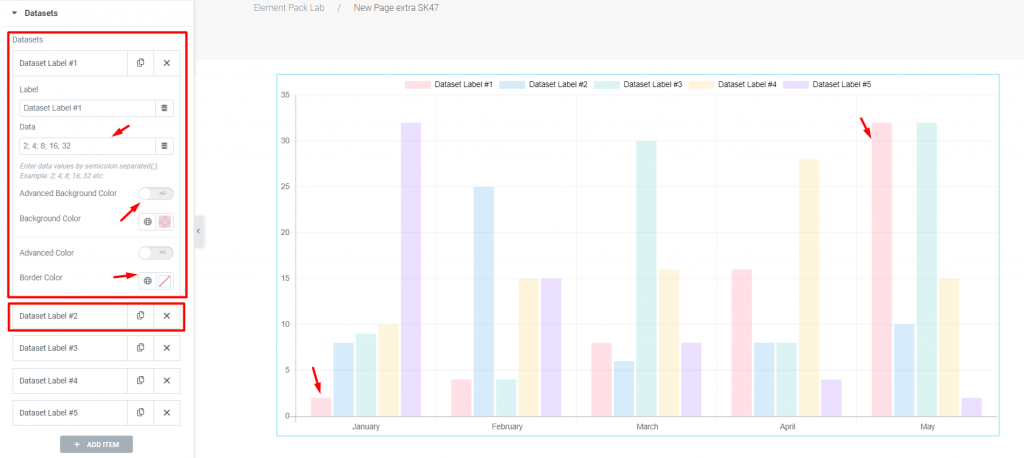
Here, you can create variables, labeled as datasets, for the chart values. By default, there are 5 entries. You can add or reduce as much as you want.
You need to name the dataset, give it a label name, then insert data values with semicolons ; as separators. Again, you can set background & border color normally or by color codes.
Additional
Go to Content> Additional
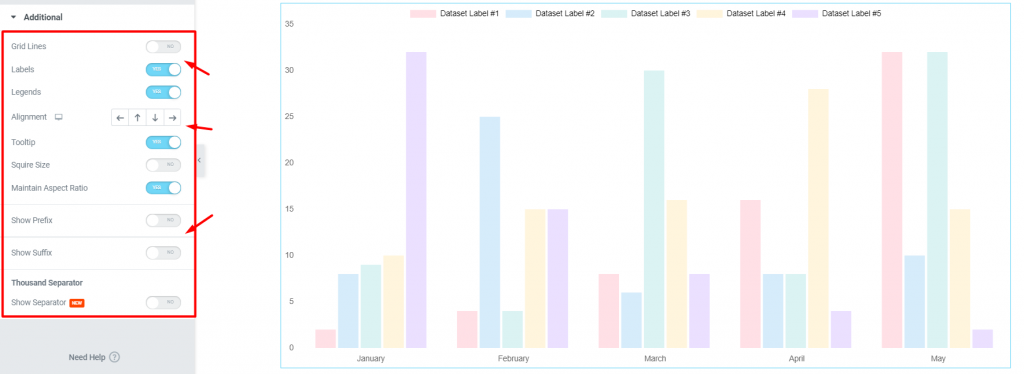
In this tab, you will get a bunch of switchers to show/hide specific items from displaying. Take an example of how we have turned off the chart grid.
Also, you have alignments, tooltip, prefix and suffix.

Once you activate the Thousand Separator switcher, values exceeding a thousand will have a character that separates the value.
You can put anything as a separator as well as flip the K Parameter switcher.
Style tab
The style tab for the Chart widget has only a single section where you can add colors to the content.
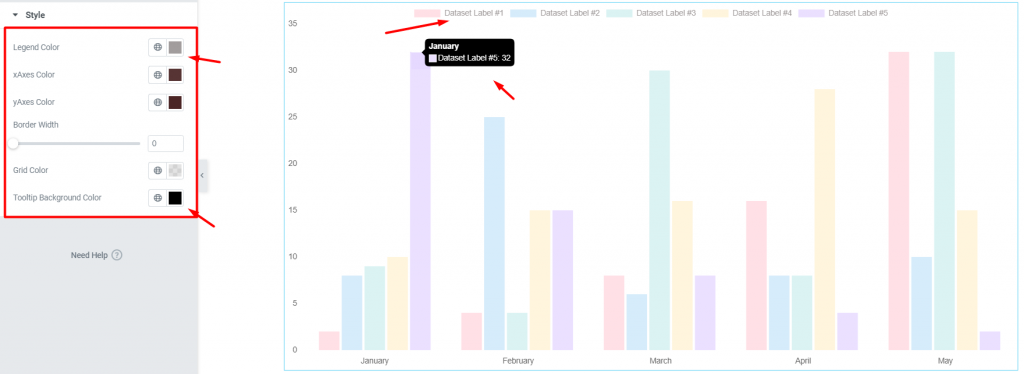
Here, you will find color options for axes, tooltip, background, and grid.
Conclusion
Watch this video for more visuals and visit the Chart widget’s demo page here, provided by Bdthemes.

